When Gurvinder, a young entrepreneur from Mohali, visited three different factories in one week, he noticed the same pattern: dusty storerooms filled with old monitors, tangled cables, dead UPS units, broken controllers, and unused printers.
Yet none of these companies knew how to legally dispose of e-waste. They were simply storing it to “avoid penalties.”
Gurvinder realised something obvious but overlooked: Punjab needs more authorised recyclers, not more storage rooms.
If you’ve ever wondered whether this sector is truly viable, this guide gives you the numbers, compliance steps, market logic, and real setup blueprint to get started confidently.
Punjab is climbing fast in digital adoption and industrial automation. With that comes a naturally higher generation of e-waste.
| Indicator | Estimated Value |
|---|---|
| Annual e-waste generated in Punjab | 20,000–25,000 MT |
| National e-waste contribution | ~2% |
| Avg. annual growth in electronics consumption | 12–15% |
| Authorized recyclers in Punjab | Fewer than 15 |
| Industrial units generating e-waste | 50,000+ MSMEs |
Business Interpretation: Demand for authorised recycling services is expanding faster than supply.
Below is a numbers-based snapshot of potential sourcing volume from major districts.
| District | Key Contributors | Monthly E-Waste Potential |
|---|---|---|
| Ludhiana | Auto parts, textiles, electrical SMEs | 400–700 MT |
| Mohali | IT parks, corporate offices, repair hubs | 250–350 MT |
| Amritsar | Retail, hospitality, logistics | 150–250 MT |
| Jalandhar | Sports & appliance manufacturers | 200–350 MT |
Choosing your zone affects:
The diversity of e-waste generated in Punjab creates a reliable and multi-stream supply.
| Source Type | Share of Total E-Waste | Typical Waste Components |
|---|---|---|
| SMEs & Factories | 40–45% | PCBs, motors, cables, automation hardware |
| IT Companies | 20–25% | Laptops, servers, routers, printers |
| Retailers & Distributors | 10–12% | Returns, DOA units, rejected appliances |
| Households | 15–20% | TVs, appliances, mobiles |
| Government Departments | 8–10% | Computers, UPS, telecom systems |
Key Insight
A recycler who secures even 1% of Punjab’s annual e-waste (~200–250 MT) can fully utilise a 1–2 TPD plant.
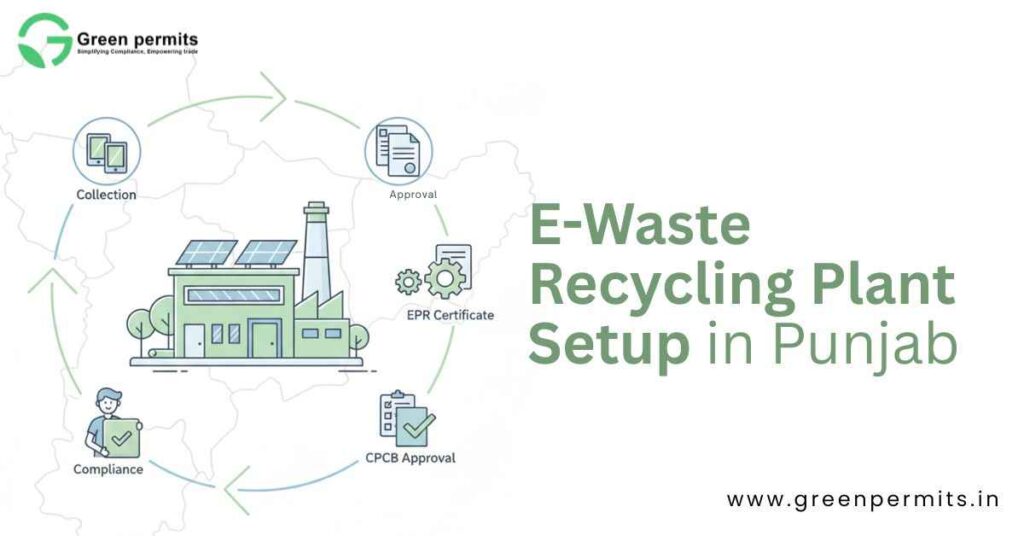
Compliance involves multiple documentation and approval steps.
| Approval | Authority | Avg. Duration |
|---|---|---|
| CTE | PPCB | 20–45 days |
| CTO | PPCB | 30–60 days |
| Hazardous Waste Authorization | PPCB | 15–30 days |
| CPCB Recycler Registration | Central Portal | ~30 days |
| Quarterly & Annual Returns | CPCB | Mandatory |
Below is a more analytical version of investment planning.
| Cost Component | Basic Dismantling | Semi-Automated | Full Metal Recovery |
|---|---|---|---|
| Machinery | ₹10–20 lakh | ₹40–60 lakh | ₹1–3 crore |
| Pollution Control | ₹2–5 lakh | ₹5–10 lakh | ₹15–30 lakh |
| Civil & Electrical | ₹3–8 lakh | ₹8–15 lakh | ₹20–40 lakh |
| Tools & Safety Gear | ₹1–2 lakh | ₹2–4 lakh | ₹5–8 lakh |
| Working Capital | ₹5–10 lakh | ₹10–20 lakh | ₹25–40 lakh |
| Expense Heads | Approx. Value |
|---|---|
| Labour (12–18 people) | ₹2–4 lakh |
| Electricity | ₹40,000–80,000 |
| Transport & procurement | ₹50,000–1.5 lakh |
| Repairs & maintenance | ₹20,000–40,000 |
| Compliance & audits | ₹10,000–25,000 |
| Revenue Stream | Approx. Margin |
|---|---|
| PCB & metal-rich scrap | 30–45% |
| Copper from cables | 25–35% |
| Plastics | 10–14% |
| Aluminium, iron & mixed metals | 15–25% |
| EPR certificate trading | Value varies by target |
ROI Expectation
Most well-run 1–2 TPD plants achieve 25–35% ROI within 24–30 months, assuming consistent supply.
| Subsidy Type | Benefit Amount |
|---|---|
| Capital Subsidy | 30–40% for MSME units |
| Interest Subsidy | 5–6% for 5 years |
| Stamp Duty Refund | Up to 100% |
| Electricity Duty Exemption | 5–10 years |
| Employment Incentives | For hiring local youth |
These subsidies often reduce initial project cost by 20–35%, improving cash flow during early years.
Punjab’s demand for authorised recyclers is growing across sectors.
| Sector | E-Waste Type | Annual Potential |
|---|---|---|
| Agro Industries | Motor drives, PCB units | 1,500–2,500 MT |
| Manufacturing | Controllers, electrical panels | 5,000+ MT |
| IT & Tech Parks | Laptops, servers | 3,000–4,000 MT |
| Retail & Consumer | Appliances, gadgets | 2,000–3,000 MT |
| Government | Computers & UPS | 1,000–1,500 MT |
Even securing 0.5% of the market from just two sectors can keep a 2–3 TPD plant operating at full capacity.
| Risk Category | Impact | Prevention Measures |
|---|---|---|
| Dust from shredding | Respiratory hazards | APC systems, masks, filters |
| PCB dust | Toxic exposure | Controlled storage, labeling |
| Batteries | Fire risk | Segregation, fire extinguishers |
| Chemical residues | Soil/water contamination | Proper disposal & documentation |
| Step | Action | Suggested Duration |
|---|---|---|
| Step 1 | Land Finalization | Week 1–2 |
| Step 2 | Apply for CTE | Week 2–4 |
| Step 3 | Machinery Procurement | Week 4–8 |
| Step 4 | Install APC & Safety Equipment | Week 6–10 |
| Step 5 | Apply for CTO | Week 8–12 |
| Step 6 | Register on CPCB Portal | Week 10–12 |
| Step 7 | Trial Production | Week 12–14 |
| Step 8 | Commercial Launch | Week 14 onward |
A typical recycling plant takes 90–120 days to become operational if documentation is correct.
Punjab presents an excellent opportunity for anyone planning to enter the e-waste recycling business. With strong industrial clusters, rising electronics consumption, and growing EPR obligations, recyclers can build stable, long-term, compliant businesses.
Entrepreneurs who focus on:
consistently outperform competitors and secure repeat business from major producers.
📞 +91 78350 06182
📧 wecare@greenpermits.in