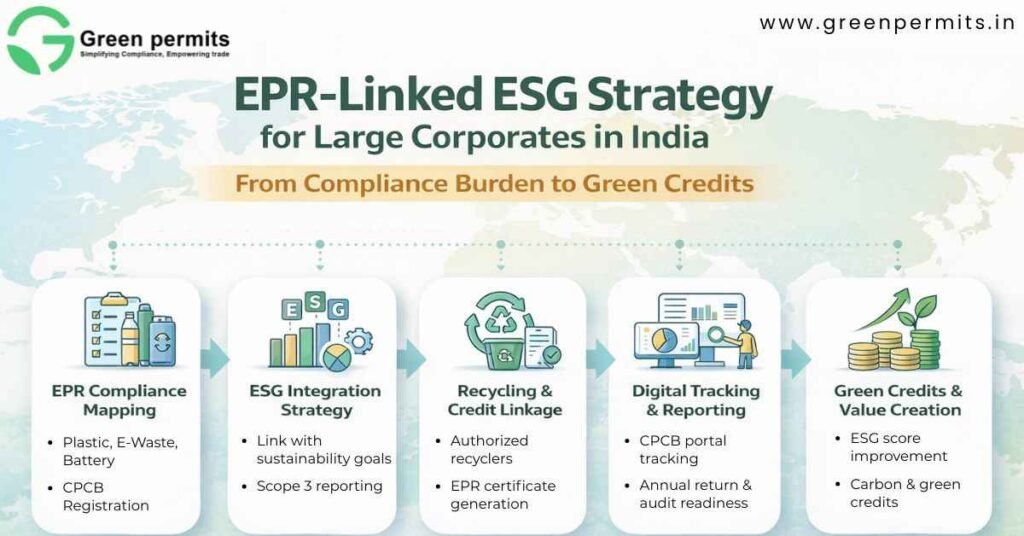
EPR-Linked ESG Strategy for Large Corporates in India 2026: From Compliance Burden to Green Credits
A leading FMCG company recently faced a CPCB compliance delay because its plastic packaging data on the EPR portal didn’t match its sustainability disclosures. What looked like a minor reporting issue quickly turned into a regulatory risk and ESG credibility concern.
This is no longer an isolated issue.
Across sectors like FMCG, electronics, automotive, and chemicals, companies are realizing that EPR compliance and ESG reporting must align at a data level—not just at a narrative level.
Why EPR is Now a Core ESG Lever for Large Corporates
EPR has evolved from a regulatory checkbox into a measurable sustainability metric that directly impacts ESG ratings, investor reporting, and operational continuity.
Today, regulators and investors expect data-backed sustainability, not declarations.
Key Shifts in Corporate Compliance Reality
EPR targets are now quantified and enforceable across sectors
ESG disclosures require auditable waste recovery data (MT basis)
CPCB portal acts as a central compliance ledger
Large corporates handling 10,000–1,00,000 MT waste annually must show traceability
Why This Matters for Corporates
ESG ratings now depend on actual recovery percentages, not policies
Investor due diligence increasingly includes regulatory compliance checks
Non-alignment between ESG reports and CPCB data can trigger:
audit flags
regulatory notices
reputational damage
For companies with ₹500 crore to ₹5,000 crore turnover, even a 5–10% compliance gap can translate into major ESG disclosure risks.
EPR Targets & ESG Measurement: Turning Waste into Measurable Metrics
EPR obligations are now structured in percentage-based targets, making them directly measurable and reportable under ESG frameworks.
Target Structure for Key Waste Streams
Minimum 8% recovery obligation in initial years
Increase to 13% in mid-phase compliance cycles
Scale up to 18% in long-term obligations
How Corporates Should Interpret These Numbers
For a company introducing 20,000 MT of plastic packaging annually:
8% target = 1,600 MT recycling obligation
13% target = 2,600 MT
18% target = 3,600 MT
These numbers directly feed into:
ESG sustainability metrics
circular economy performance indicators
Scope 3 emission reductions
ESG Impact Areas
Waste diversion from landfill (MT/year)
Resource recovery efficiency (%)
Recycled material usage (%)
Carbon reduction from secondary materials
Companies failing to quantify these metrics risk ESG score downgrades.
Regulatory Framework Governing EPR-Linked ESG
Regulation
Key Requirement
Deadline
Applicable To
Risk if Ignored
Plastic Waste Rules (Amended)
Category-wise EPR targets
30 June annual filing
Brand Owners, Importers
Portal suspension
Battery Waste Rules
Collection & recycling obligation
Annual cycle
Manufacturers, Importers
Environmental compensation
ELV Rules
Certificate purchase obligation
30 April declaration
Automobile sector
Registration rejection
Environment Protection Act
Legal enforcement
Continuous
All entities
Fine + imprisonment
Business Interpretation
Compliance is now multi-regulatory, not single-rule
One company may fall under 2–4 EPR categories simultaneously
Non-compliance in one category can impact overall ESG credibility
How CPCB Portal Drives ESG Accountability
The CPCB portal is no longer just a filing system—it is a real-time compliance tracking mechanism.
Core Functions That Impact Corporates
Digital registration of producers and importers
Certificate generation and transaction tracking
Quarterly data validation
Annual audit-ready reporting
Compliance Data That Must Match ESG Reports
Quantity introduced in market (MT)
Quantity recycled (MT)
Certificates purchased (units/MT)
Shortfall (if any)
Typical Compliance Timelines
Step
Timeline
Risk Level
Registration approval
15–30 days
Medium
Target declaration
Before 30 April
High
Certificate procurement
Ongoing
High
Annual filing
Before 30 June
Critical
Practical Risk
Even a 2–3 week delay in certificate procurement can result in:
filing rejection
carry-forward liability
ESG reporting mismatch
EPR Certificates as ESG Assets: The Green Credit Opportunity
EPR certificates are emerging as measurable sustainability instruments that corporates can strategically manage.
How the Model Works
Recyclers process waste and generate certificates (per MT)
Producers purchase certificates to meet obligations